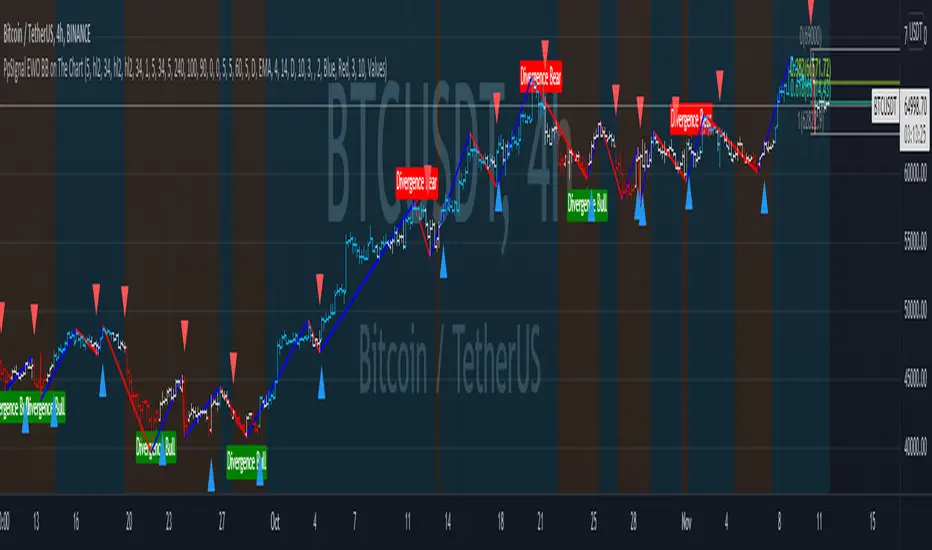
Market Trading Tools - DivergencesOur Divergence indicator is another indicator we are happy to present to interested traders. The indicator detects the possible trend change and it is a well known tool among traders based on bullish and bearish divergences.
To use the indicator well, it will spot divergences but some minimal work might be needed to be done as connecting the waves together to make sure that you get the best entries. You can also wait for the dots to appear in order to take a trade either long or short depending on whatever financial market you are trading and your trading strategy.
The red dots will signify a bearish divergence (trend reversal to the downside), while the green dots will signify a bullish divergence (trend reversal to the upside). The orange and purple dots also will signify a stronger divergence either bullish or bearish .
The divergence indicator we are publishing today works on crypto, stocks, forex, futures and almost all financial assets, however we do recommend using higher time frames for better results and to filter the noise around the divergences (dots), however using lower time frames can just allow you a better entry sometimes since reversals happen on lower time frames than larger ones.
Once you are granted access to use it, add it from going into the scripts >> invite only scripts >> enable the indicator (click on it once). Once the indicator is added to your chart you will see the indicator popping up to a lower pane.
We are happy to announce that our trading indicator is special and unique from different ones because of the features added above + we have added alerts to it. We believe that the indicator plotting and style on chart is also clean and easy for the eyes to catch compared to other indicators around. We have also enabled a function for our users to get a better view of the trend when they add the indicator to their chart. You can now view the trend background color (red&green) depending on if the price is above the EMA of your choice. you can also check whichever time interval you want that does not limit you to the time interval chosen on your chart itself.
Hope you enjoy it, Good luck and stay safe!
** If you are interested in this indicator. please use the link below to obtain access to this indicator
[b]forex

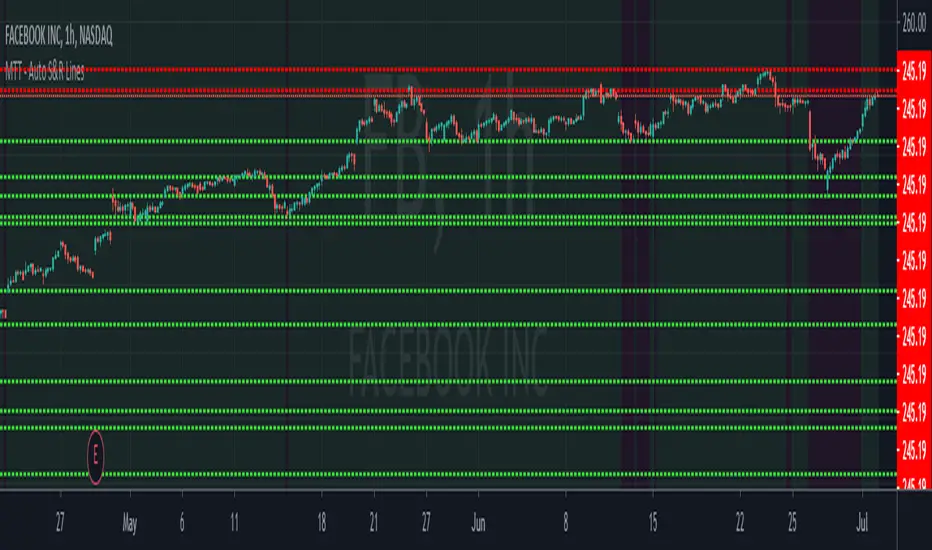
Market Trading Tools - Auto Adjustable Support & ResistanceOur Auto Adjustable Support & Resistance indicator draws support and resistance lines that can help you estimate where a ticker or financial asset can range, reach or break. The support lines are in lime color while the resistance lines are in red. The colors will automatically change depending on where the candle is. So for example, if the candle is above the support line, the support line will be in lime, if it breaks that support line and closes below it, the same line will turn red becoming a resistance.
** The lines are adjustable, for example, if a stock or financial market broke a resistance and is moving to its all time high, then the line will keep moving with it until it rejects a certain zone. Accordingly, the supports below it will change to the nearest supports formed.
** The indicator can be used on any financial market; crypto, stocks or forex. We do not recommend a certain time frame as each time frame usually has its own support and resistance (the higher the time frame is the similar it will have same support and resistance zones, for example, a 4HR and 1 Day time frame might have similar support and resistance zones)
Once you are granted access to use it, add it from going into the scripts >> invite only scripts >> enable the indicator. Once the indicator is added to your chart you will see the indicator popping up on your chart.
We are happy to announce that our trading indicator is special and unique from different ones because it is adjustable to the current price ranges. We have also enabled a function for our users to get a better view of the trend when they add the indicator to their chart. You can now view the trend background color (red&green) depending on if the price is above the EMA of your choice. you can also check whichever time interval you want that does not limit you to the time interval chosen on your chart itself.
Hope you enjoy it, Good luck and stay safe!
** If you are interested in this indicator. please use the link below to obtain access to this indicator.
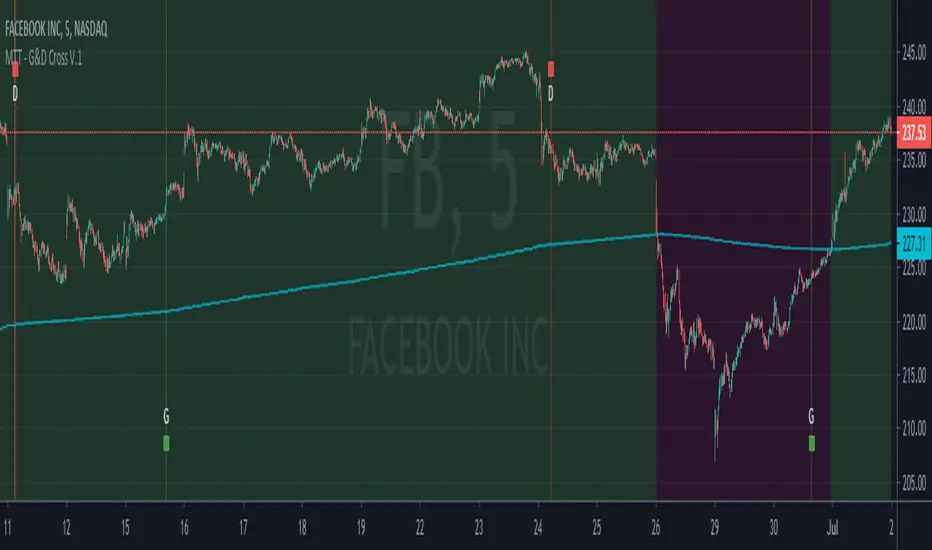
Market Trading Tools - Golden & Death Crosses + AlertsOur Golden & Death Cross indicator is another indicator we are happy to present to interested people. The indicator detects the possible trend change and it is a well known tool among traders.
To make it more convenient for your use we have labeled the golden gross with a G and there is a green vertical bar that is available on the signal. Same for the death cross we have put a D and a red vertical bar.
The indicator can be used on any financial market; crypto, stocks or forex. We do not recommend a certain time frame as each time frame usually this depends on each trader to another, but it works on every time frame, the signals will appear on any time frame used.
Once you are granted access to use it, add it from going into the scripts >> invite only scripts >> enable the indicator. Once the indicator is added to your chart you will see the indicator popping up on your chart.
We are happy to announce that our trading indicator is special and unique from different ones because it has alerts added to it and that feature isnt really available in most of the indicators around. We believe that the indicator plotting and style on chart is also easy for the eyes to catch and will probably not intersect with other indicators you might have on your chart, or at least our other indicators.
We have also enabled a function for our users to get a better view of the trend when they add the indicator to their chart. You can now view the trend background color (red&green) depending on if the price is above the EMA of your choice. you can also check whichever time interval you want that does not limit you to the time interval chosen on your chart itself.
Hope you enjoy it, Good luck and stay safe!
** If you are interested in this indicator. please use the link below to obtain access to this indicator.
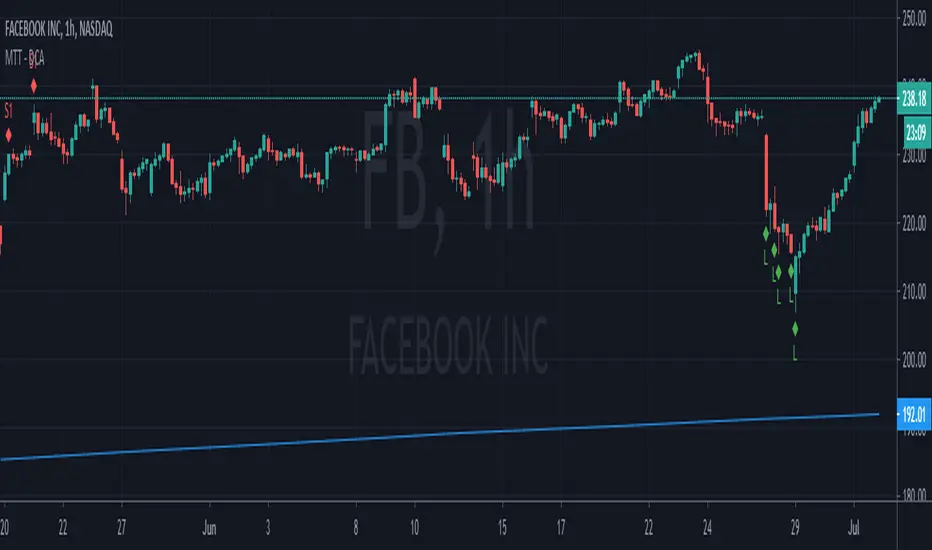
Market Trading Tools - BOOM DCAOur DCA tool is an indicator that is mostly based on RSI. The DCA tool is there to let you know where you should start averaging your entries or longing or shorting a financial asset. It can also give you an idea about when a market can start going the other way depending on the time frame you are using.
DCA will signal two different buy signals and two different sell signals L/L1 - S/S1. S is for Short and L is for long. These signals can be used according to your own desire, S1 and L1 are a condition and S and L are a condition, it is rare when both will occur close to each other but in some cases they can be close depending on market situation. The indicator algorithm is based on 2 indicators, when these two intersect, the signals will be fired once the conditions are met.
** Our Indicator does not repaint.
** It can be used on any financial market; crypto, stocks or forex. We also encourage using time frames as law as the 15 minutes and above. The use of a higher than 4hr time frame requires special settings and once you have access to it, you can change the parameters as you want. We have enabled our users to freely use the settings as they wish and to their on discretionary.
Once you are granted access to use it, add it from going into the scripts >> invite only scripts >> enable the indicator. Once the indicator is added to your chart you will see the indicator popping up on your chart.
We believe that we have not seen a similar indicator, and we are proud of our work and we will continue updating the indicator when we believe it is necessary according to market changes.
Good luck! and stay safe!
** If you are interested in this indicator, please use the link below to obtain access to it.
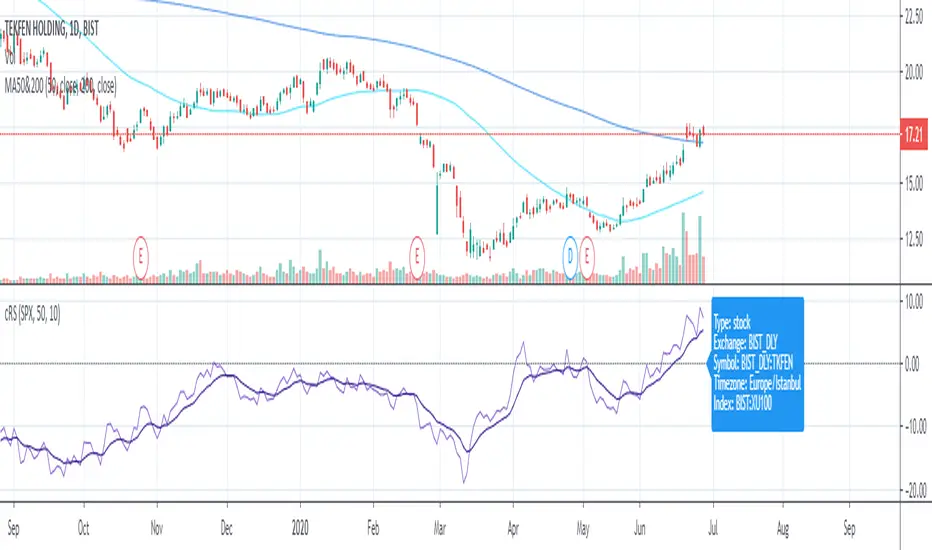
Relative Strength Auto ComparisonRelative Strength Comparison with automatic selection of relevant index
Added support for most european and north american exchanges.
FauxLife EFIModification to Elder's Force Index (EFI)
Ability to change calculation from standard EMA to your choice of SMA, EMA, WMA, or HMA. Very interesting results!
Adjust lookback from standard/suggested 13 candlesticks
Added a color indication to positive or negative force reading
Added background color tint for an easier read on dashboard setups
Suggested pair with my On Balance Volume with Cross to use as a filter & entry/exit setup. Enter or exit trades when the two indicators switch at the same time or within 1-2 candlesticks of each other.

[astropark] Volume that mattersDear Followers,
does volume say something about market makers and what will happen in near future?
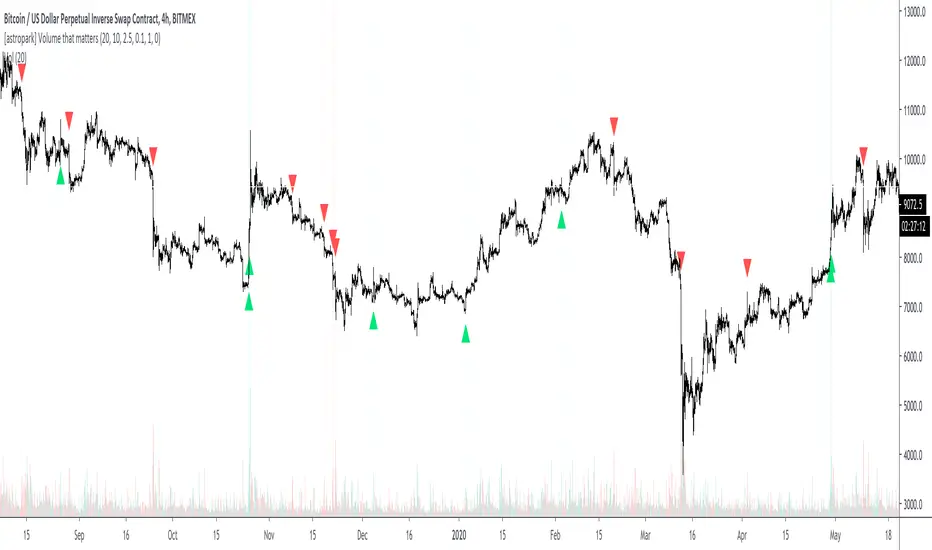
Today a new Price Action Tool , the "Volume that matters" indicator.
When a Market Maker executes his/her orders, there is no way he/she can do it without giving us some footprints: volume!
Specific Volume spikes happen as
reactions at support or resistance range , as well as at supply and demand zones
market makers' actions
trend switching in short-term and mid-term future
They can be both bullish or bearish , but the real problem is that not all, but only a few volume candle matters ! And this tool will filter them for you.
This indicator works
on every timeframe (eg. 15m, 30m, 1h, 2h, 4h, 6h, 1D, ...), the higher, the better!
on cryptocurrencies (eg. XBTUSD, ETHUSD, ETHBTC, both USDT and BTC markets, ...)
on forex (eg. EURUSD, GPBUSD, JPYUSD, ...)
on stocks (eg. AMZN, FB, TSLA, GOOG, NFLX, ...)
on commodities (eg. GOLD, SILVER, OIL, ...)
This indicator has following options:
edit volume filter and period analysis
edit filter based on fixed or percentage volatility change
edit filter based on candle value size
show a suggestion of possible entries and stoploss
You can enhance your trading by using it together with my "Engulfing that matters", my "Pinbar that matters" and my "Breaker Blocks (BB) and Supply/Demand Order Blocks (OB)" indicators, so you can easily spot confluences and have more confidence in trades.
Here my Engulfing that matters indicator
Here my Pinbar that matters indicator
Here my Breaker Blocks (BB) and Supply/Demand Order Blocks (OB) indicator
Here below some examples on how to use the indicator.
BTCUSDT 1D
ETHUSD 4h
LINKBTC 1h
EURUSD 4h
AMZN 1h
XAUUSD 4h
Here below an example of suggested entries and stoploss
This is a premium indicator , so send me a private message in order to get access to this script .
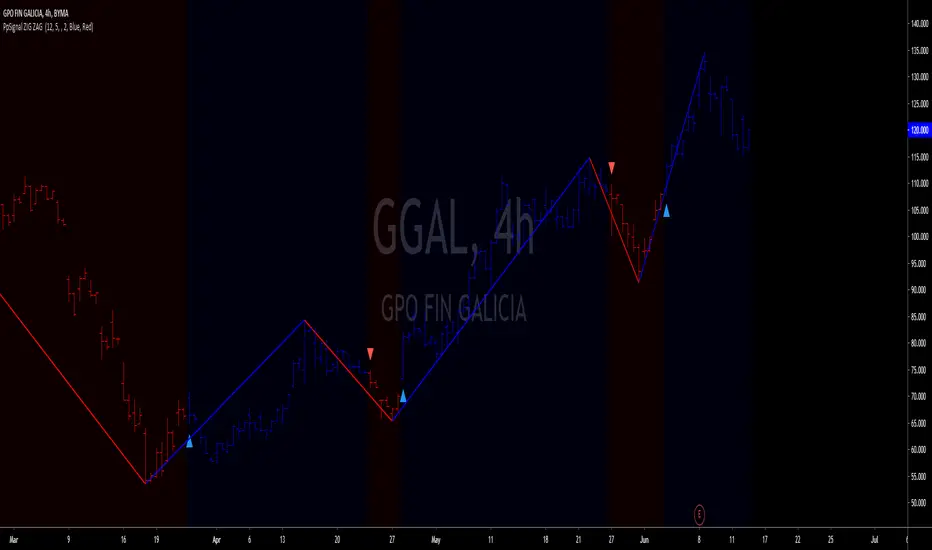
PpSigan ZigZag++The Zig Zag indicator plots points on the chart whenever prices reverse by a percentage greater than a pre-chosen variable. Straight lines are then drawn, connecting these points. The indicator is used to help identify price trends. It eliminates random price fluctuations and attempts to show trend changes. Zig Zag lines only appear when there is a price movement between a swing high and a swing low that is greater than a specified percentage; often 5%. By filtering minor price movements, the indicator makes trends easier to spot in all time frames.
Buy when the price is blue or green choose your favorite up color and arrow is up.
sell when the price is red or orange choose your favorite up color and arrow is up.
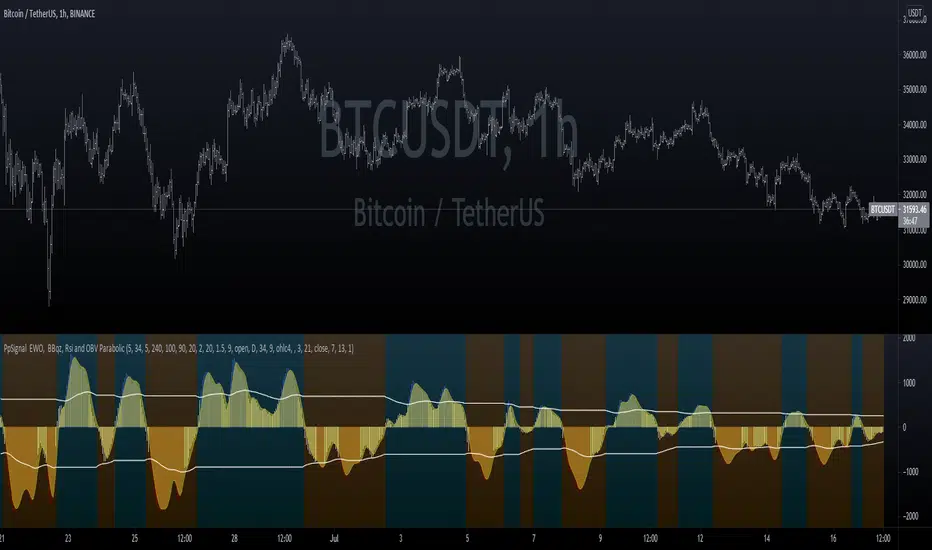
PpSignal EWO, BBqz, Rsi and OBV ParabolicEWO Break Band, bbsqeeze, rsi tdi and OBV of rsi all in one.
Buy when the oscillator change a color blue and sell when the oscillator changes color to red.
PpSIgnal EWO BB on The ChartThis gauge is the band break Ewo, or rather known as the advance get the mechanical trader ewo.
Buy when the back and the candles are painted blue, if you activate see ewo on the chart buy when the candles are above the upper band.
Sell when the back is selling and the candles are painted red or if the ewo is on the chart sell when the candle is below the band.
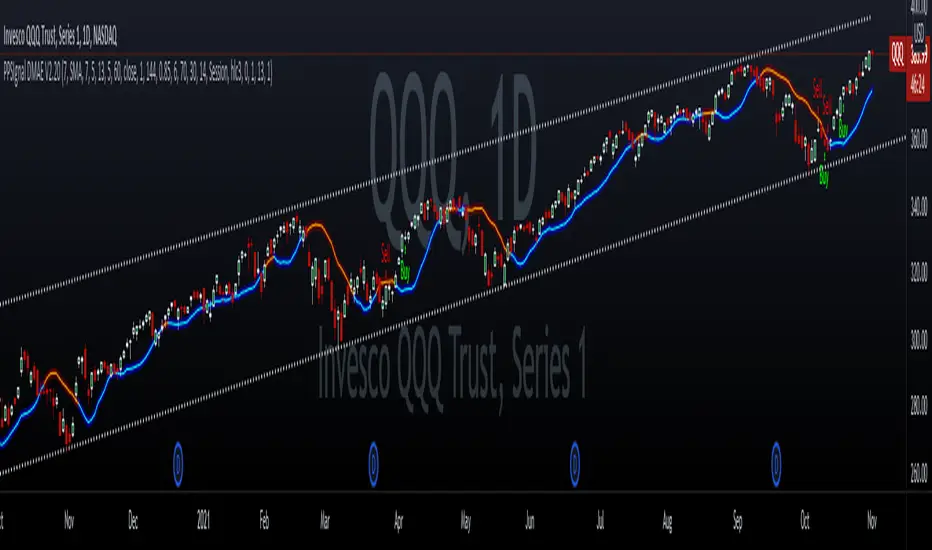
Ppsignal Displaced Moving Average V 2.20This moving average was developed by John Josephen in his Mechanical Trader Book.
Buy when the price is above the moving average you will also see that the candles are painted yellow.
Sell when the price is below the moving average, you will also see that the candles are painted red.
It also has the standard deviation 13 periods and deviation 1 of the same moving average and the deviation atr 13 deviation atr 1 of the same moving average
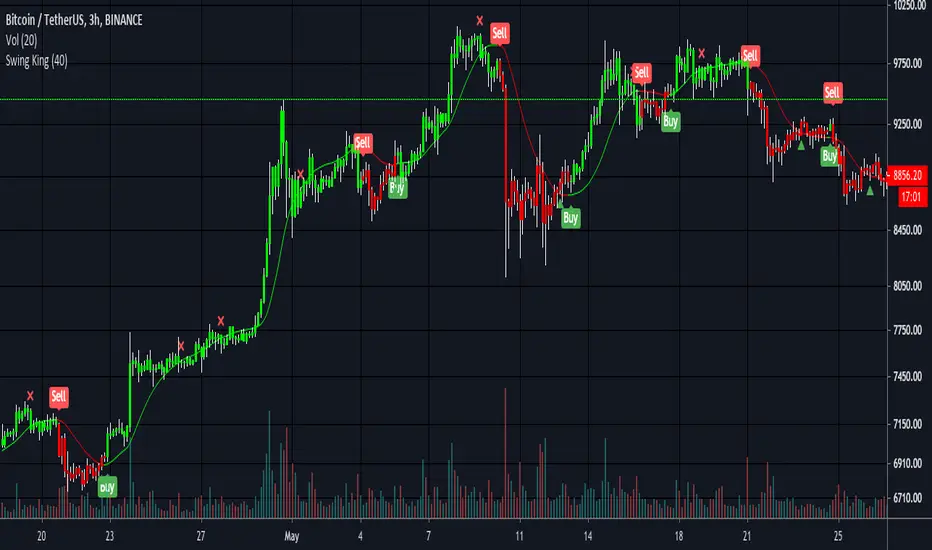
Swing King v1Utilising short and medium term trends, Swing King is perfect for riding the crypto waves. Built with the aim of smashing Bitcoin’s buy and hold return. After 5 months (Jan 2020 to May 2020) of testing and tweaking, Swing King is ready for release.
Setup with default Bitcoin settings, Swing King returned 289% in the 5 months of testing compared to buy and hold return of 29%. That’s by longing and shorting 100% of equity at 1x leverage.
Results of 5 months of testing:
1 bitcoin → 3.02 bitcoin
$7,340usd → $28,589usd
Backtesting on Ethereum had similar results. In 6 months it turned 10 eth into 14.5 eth and doubled the bitcoin value - compared to a buy and hold value of 31%.
These results were achieved with:
- Using 0.2% fees and slippage for worst case scenario
- Not using Heiken Ashi candles to fake backtest results
- No stop loss and 30% long take profit
Expect to be in trades for days and keep your losses small while letting the winners run.
Also includes trend weakening signals for manual take profit zones (cross is bullish trend weakening and triangle is bearish trend weakening) and colour coded barcolours to keep trading simple.
Green = all signals met to long
Red = all signals met to short
DM for access and pricing. Places will be limited.
[astropark] Pinbar that mattersDear Followers,
today a new Price Action Tool , the "Pinbar that matters" , also known as Hammer (bullish case) and Inverted Hammer (bearish case).
Everybody knows the importance of pinbar to highlight
reaction at support or resistance range , as well as at supply and demand zones
market makers' actions
trend switching in short-term and mid-term future
They can be both bullish or bearish , but the real problem is that not all, but only a few pinbar matters ! And this tool will filter them for you.
This indicator works
on every timeframe (eg. 5m, 15m, 30m, 1h, 2h, 4h, 6h, 1D, ...)
on cryptocurrencies (eg. XBTUSD, ETHUSD, ETHBTC, both USDT and BTC markets, ...)
on forex (eg. EURUSD, GPBUSD, JPYUSD, ...)
on stocks (eg. AMZN, FB, TSLA, GOOG, NFLX, ...)
on commodities (eg. GOLD, SILVER, OIL, ...)
This indicator has following options:
edit filter based on fixed or percentage volatility change
edit filter based on candle value size
show a suggestion of possible entries and stoploss
Be sure to edit both fixed and percentage volatility options in order to have a correct filter on your chart and timeframe.
You can enhance your trading by using it together with my "Engulfing that matters" and my "Breaker Blocks (BB) and Supply/Demand Order Blocks (OB)" indicators, so you can easily spot important points where to start a short or a long trade.
Here my Engulfing that matters indicator
Here my Breaker Blocks (BB) and Supply/Demand Order Blocks (OB) indicator
Here below some examples on how to use the indicator.
XBTUSD 5m
ETHUSD 15m
BNBBTC 1h
ETHBTC 12h
EURUSD 1h
JPYUSD 4h
AMZN 5m
FB 4h
XAUUSD 15m
Copper Futures 1h
Here below an example of suggested entries and stoploss
This is a premium indicator , so send me a private message in order to get access to this script .

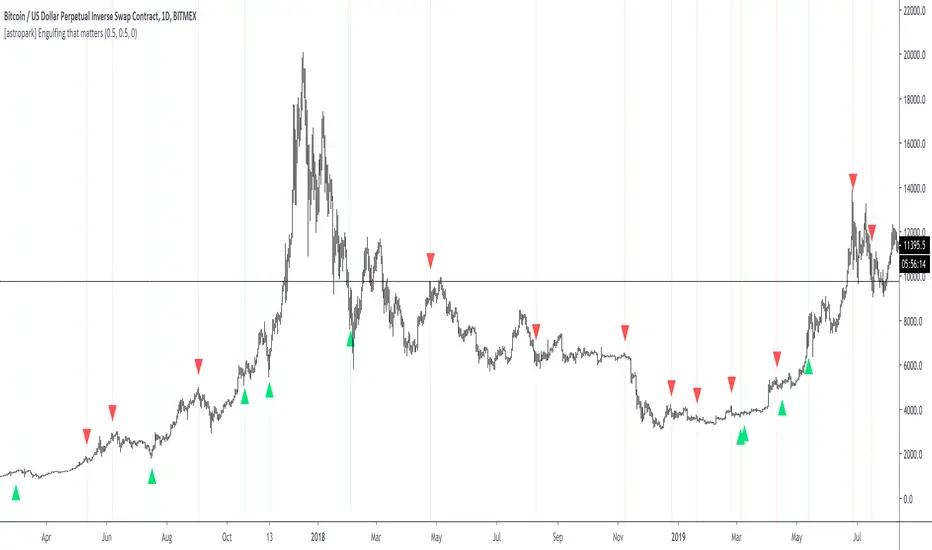
[astropark] Engulfing that mattersDear Followers,
today a new Price Action Tool , the "Engulfing that matters" .
Everybody knows the importance of engulfing to find
supply and demand zones
market makers' actions
trend switching in short-term and mid-term future
They can be both bullish or bearish , but the real problem is that not all, but only a few engulfing matters ! And this tool will filter them for you.
This indicator works
on every timeframe (eg. 5m, 15m, 30m, 1h, 2h, 4h, 6h, 1D, ...)
on cryptocurrencies (eg. XBTUSD, ETHUSD, ETHBTC, both USDT and BTC markets, ...)
on forex (eg. EURUSD, GPBUSD, JPYUSD, ...)
on stocks (eg. AMZN, FB, TSLA, GOOG, NFLX, ...)
on commodities (eg. GOLD, SILVER, OIL, ...)
This indicator has following options:
edit filter based on fixed or percentage volatility change
edit filter based on candle value size
show a suggestion of possible entries and stoploss
You can enhance your trading by using it together with my Breaker Blocks (BB) and Supply/Demand Order Blocks (OB) indicator, so you can easily spot important points where to start a short or a long trade.
Here my Breaker Blocks (BB) and Supply/Demand Order Blocks (OB) indicator
Here below some examples on how to use the indicator.
BTCUSDT 1D
ETHUSDT 1h
BNBBTC 4h
EURUSD 30m
GBPUSD 5m
TSLA 1D
FB 4h
XAUUSD 4h
XAGUSD 15m
Brent Oil 1D
Here below an example of suggested entries on stoploss
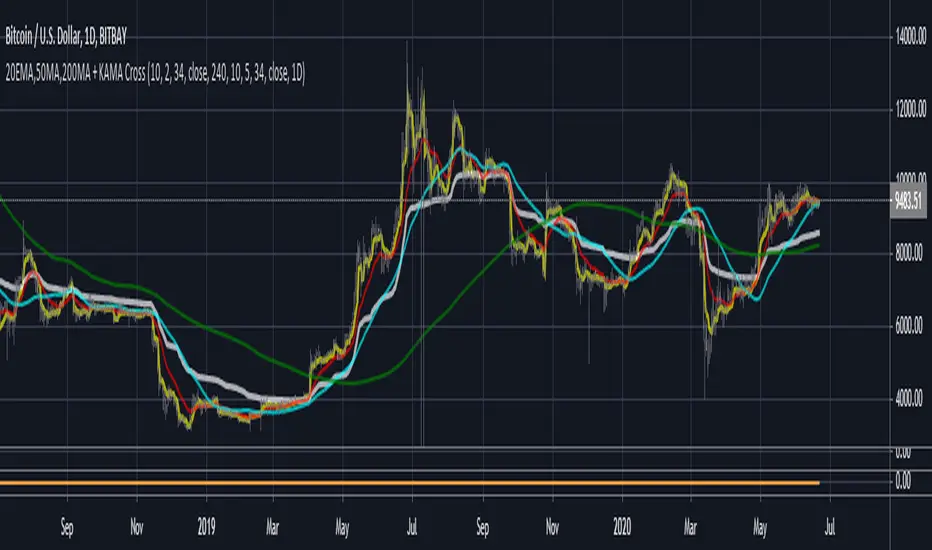
3MA'S + KAMA Trend (20EMA,50MA,200MA + KAMA Trend)This indicator, combines the traditional FOREX moving averages (20EMA, 50ma, 200ma) into a single indicator with
an adaptive moving average (AMA) taken from a user defined timeframe to show trend direction (by default, it plots
the daily 10/2/34 KAMA overlayed on any timeframe chart.
An AMA moves slowly when markets are sideways but swiftly during periods of volatility as a result it reacts much fast than
traditional options for moving average trends.
If the price is above the KAMA, trend is up. Below the KAMA, trend is down.
Cracking Cryptocurrency - IchimokuCracking Cryptocurrency Ichimoku
The Ichimoku Cloud is designed to measure both momentum and trend. This script is optimized for **Cryptocurrency** by default but the settings can easily be adjusted from the Input Window to trade on any asset.
The core of the Ichimoku Strategy can be broken down into two facets, depending on whether you prefer to trade short-term or long-term. The Ichimoku is a trending indicator by default, it will not catch bottoms or tops. It is a momentum indicator .
Features & Functions
Multiple Time Frames Feature: With this feature, you can view the Ichimoku of a different time frame than you are currently viewing. This is very useful for looking at daily support and resistance (Kumo, Chikou) but wishing to trade a different strategy (Price Action, Moving Averages, etc.) on a lower time frame.
Short-Term Strategy
Revolves around Tenkan and Kijun crosses. Should the Tenkan crossover the Kijun, that is a bullish indication, and a signal to buy or go long.
Conversely, should the Tenkan crossunder the Kijun that is a bearish indication, and a signal to sell or go short.
In the settings, you can choose to plot Tenkan/Kijun crosses. With this option selected, several things will occur when Tenkan/Kijun crosses happen.
1. The current bar will change colors depending on whether the signal is a buy or a sell. Buy = Aqua, Sell = Fuchsia
2. A dot will appear on the Tenkan. Buy = Green, Sell = Red
3. A label will appear above or below bar indicating the correct decision. Buy = Buy, Sell = Sell.
Long-Term Strategy
Revolves around price closing above or below the Kumo Cloud itself. Should price close above a bearish Kumo Cloud, that is a bullish indication, and a signal to buy or go long.
Conversely, should price close below a bullish Kumo Cloud, that is a bearish indication, and a signal to sell or go short.
In either case, it's important to understand what the cloud breaks are representing. They are representing a potential shift in the dominant trend. Ichimoku attempts to identify when that shift happens, so we can get on the side of the emerging trend.
In the settings, you can choose to plot Kumo Cloud Breaks. With this option selected, several things will occur when Kumo Cloud breaks happen.
1. The current bar will change colors depending on whether the signal was a buy or a sell. Buy = Aqua, Sell = Fuchsia
2. A label will appear above or below bar indicating the correct decision. Buy = Buy, Sell = Sell.
---
Please note, that the Kumo Cloud Breaks indicate stronger signals, and thus more weight should be given to them than TK Crosses. However, depending on what time frame you are trading on, Kumo Cloud breaks are a rarer occurrence than TK Crosses.
---
Additional Features
---
The Chikou (Lagging) Spam is run through a Zero Lag filter. The reason for this is aesthetic. The smoothing can be disabled in the input windows.
The purpose of the Chikou Span is to identify Support and Resistance.
If you have any questions, success or failure stories, or seek advice feel free to send me a private message here on Trading View. Trade safely.

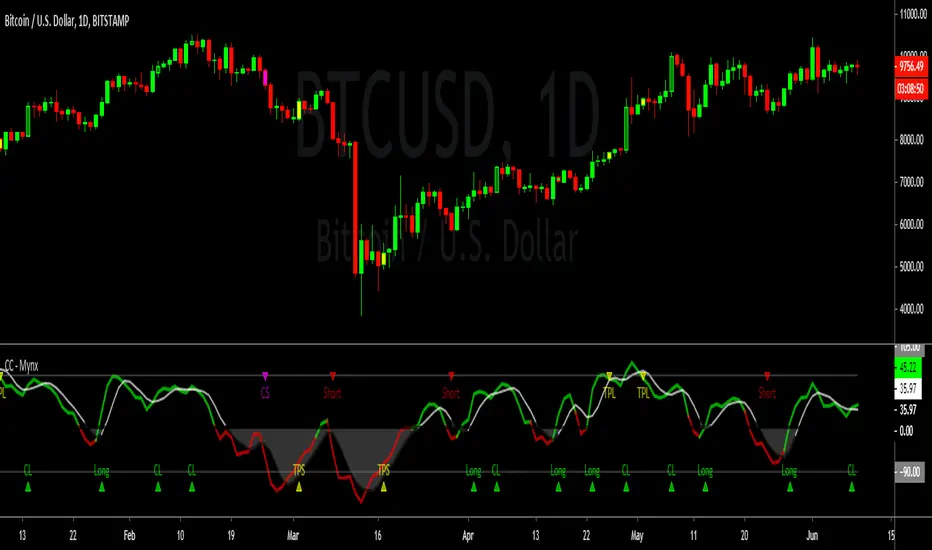
Cracking Cryptocurrency - MynxCracking Cryptocurrency - Mynx
Mynx is a powerful trend-following indicator which logic built in to facilitate nuanced aspects of PTP strategy. Continuation Trades, Early Exit Signals and Full Take Profit Signals are all built into Mynx. Mynx is designed to identify when the market is signaling that a trend is beginning as well as signalling when you may safely re-enter into a pre-existing trend. It also tells you where to exit prematurely to avoid significant capital loss on a losing trade, and when to take full profit in order to get out of a position at maximum profitability.
Should you have difficulty adding it you can search for 'Cracking' in the indicator window of your Trading View Platform, and it will appear along with the rest of our indicators.
As you will notice, Mynx is similar in nature to Time Transformation, in that it is both a Centered Oscillator and a Line Cross Indicator. This allows a wide range of possibilities which we will exploit to extract profit out of the market.
The most important line is the BPM or Mynx Line. This is going to be the thicker, brighter colored line on our indicator that will switch from green to red depending on the dominant trend. The color changing feature of this line will denote where our indicator is in relation to our zero line. If our BPM Line is green, then price is trading above our zero line, if red than it is trading below. Therefore we can quickly see what our last signal was, and whether our indicator is bullish or bearish depending upon the color of our BPM Line. If Green, we are in long territory, if red we are looking for shorts.
Our second area of importance in this indicator is our Noise Line and Area. This is the black or white line which will change color depending on where Noise is relative to our zero line. Black if above the zero line, meaning we are in long territory, and white if below, indicating we are in shorting territory. The area between the zero line and the Noise Line is shaded black or white as well, and denotes no-trade zones for us. If our BPM Line is within our Noise Area, we are not in a trade. We are only in a trade when our BPM Line is breaking away from Noise Line, either to the upside or the downside. When BPM curls back and re-enters our Noise Area, that is an indication to exit our position regardless of our Take Profits or Stop Losses.
Our Zero Line is indicated by a thick black line for easy of identification, which will be our primary signal generator when our BPM Line crosses above or below it, and our faint gray lines are going to be our Overbought and Oversold levels respectively. These will play a function in how we take profits.
Settings
Let's take a look at the settings of our Mynx Indicator.
The first field we will see is our BPM Source, how many beats per minute we want in our cycle length. The default is ten, and through back-testing I find this to be the optimum level.
Our Noise Filtration level corresponds to our Noise Line and Area. Again, I find the default settings as I have programmed them work best on all time frames, however you might find optimum signals by playing around with these settings. As in all things, nuance and experimentation is what excellence is borne of.
We can adjust our Oversold and Overbought Parameters, making it easier or harder for us to get a Full Take Profit Signal from this indicator. We can also adjust our Base Line. Keep in mind, our Base Line is going to be an Exponential Moving Average and here we can adjust the length of our desired Base Line.
To incorporate our Multi-Time Frame feature, below this section we can see that the default option will be to use a Base Line of the current time frame. If however, we want to trade on a Lower Time Frame and reference a base line of another time frame, we can simply un-check that box and input the desired Time Frame of the Base Line we wish to reference.
Now for the true appeal of Mynx in user friendliness, below this we can see that we have full control of the signals we want Mynx to generate for us. By default, we have enabled Mynx's best signals, Trending Signals. We can choose to plot Continuation Crosses and Reversals Within the Trend, both of which are trades we are allowed to take and I recommend taking in a proper PTP system. We can choose to use Mynx as a reversal indicator, to plot Raw Reversals against the trend, which I do not recommend enabling unless you want to by pass PTP entirely. We can choose to plot when Mynx gives us a Full Take Profit signal, a signal to take full profits on our position. We also have the option to plot for early exits. The Option for Sensitive Stop Loss is the same as early exits, and will plot an exit signal every time the BPM Line drifts back into the Noise Area. These are fairly easy to see upon bar closes, so I left it disabled by default. If you enable it you will get a visual signal to exit your position upon a bar close.
One final note, we can adjust the source upon which Mynx is basing her signals. By default, this value is hl2 , which I found in back-testing to be the most efficient with minimum draw down. However, there is a higher profit potential with HLC3 and OHLC4, but be warned that with that extra profit potential comes the risk of more draw down. The draw down settles out in the end, however there will be months where you drastically under perform Alpha, where as hl2 keeps you consistently outperforming the market at all times. This is a very personal choice, and I leave it upon you to make the right one.
In our Style Tab, we can adjust our Color Scheme to better accommodate the way that you trade. I have done my best to be very concise and detailed in labeling to make this task easy.
Strategy
Please let me know of your success stories with Mynx, as well as any features you think would be helpful to add. If you notice any errors within it, please notify me so I can fix them. I have back-tested this strategy many times in many different settings, and it consistently outperforms the market and generates Alpha. I now place it within your hands to achieve the same results. Trade Safely.
PpSignal On Balance Volume Reflex this indicator is On Balance Volume (OBV) and BB Stop with ema.
Buy: when the OBV is over Move average (gold) and BBstop is aqua.
Sell: when the OBV is below the moving average and BBstop is orange.
Check all time the tendency with channel support and resistance and Fibonacci levels.

[astropark] VWAP Crosses [alarms]Dear Followers,
today a new Swing and Scalping Strategy based on WVAP , mainly designed for Bitcoin and High-Cap Cryptocurrencies, like Ethereum. It works also on Forex and Stocks.
It works great since 15m and above till 1D. I suggest you to use it on 15m, 30m or 1h timeframes .
VWAP or "Volume Weighted Average Price" is a volume-based indicator similar to a moving average.
This trading indicator is used to identify market resistance and support levels and is represented as a weighted average price for the treaded volumes.
My strategy will help you identify main support-resistance level to be careful of and it will trigger a buy or a sell depending on how price will intereact with vwaps.
green means we are in a bullish trend, in fact it start with a "buy" signal
red means we are in a bearish trend, in fact it start with a "sell" signal
blue means we are in a moment where trend may change, so be careful and always remember that taking profits is awesome and have a stoploss is a must in trading
The user who wants to use this strategy, especially via an automated bot, must always set a stoploss (example 150$ from entry on bitcoin) or use a proper risk management strategy .
This is not the "Holy Grail", so use it with caution. It's highly suggested to use a proper money management .
This script will let you set all notifications you may need in order to be alerted on each triggered signals.
The one for backtesting purpose can be found here below:
This is a premium indicator , so send me a private message in order to get access to this script.

[astropark] Fair Value GapsDear Followers,
today a new epic tool, the "Fair Value Gap (FVG) Finder" .
Fair Value Gaps are quite important to trade, as they represent both volume and trading unfilled gaps, which most of the time are filled and then price reverse .
This indicator will let you set alerts on when a new FVG is found and when it is filled.
Traded together with Breaker Blocks (BB) and Supply/Demand Order Blocks (OB) , you can easily spot important points where to start a short or a long trade.
Here my Breaker Blocks (BB) and Supply/Demand Order Blocks (OB) indicator
Here below some examples on how to use the indicator.
On Bitcoin
On EURUSD

PpSignal Blau Balance IndicatorOn Balance Volume in candle mode with a reference moving average and the option price smoothed by elder, buy when ONV is above the moving average and sell when it is below, you will also see the color change of the background buy orange sell orange . enjoy it

PpSignal Parabolic SAR and LWSMAParabolic sar and LEMA in heiken ashi indicator mode, buy when Parabolic sar this aqua and LWMA candles are aqua too, sell when both indicator colors are orange

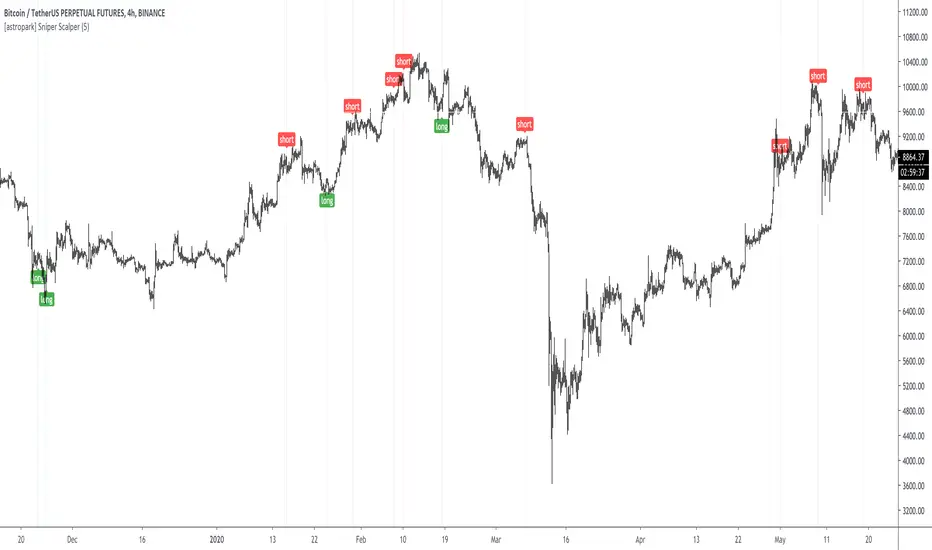
[astropark] Sniper ScalperDear Followers,
today a new Scalper Tool , which works great on all timeframes , from 1 minute to 1 month!
Keep in mind that this is a Scalper, so it's always a good idea to take or lock your profits, despite you may use it also for swing trading.
This tool has some cool features:
it works on all timeframes , from 1 minute to 1 month!
you can change a filter option from 1 (lowest) to 7 (highest)
Here some examples on how it performs on many timeframes and charts.
EURUSD 15m chart
AMZN 1h chart
Bitmex XBTUSD 4h chart
Bitfinex ETHUSD 1h chart
Binance Chainlink LINKBTC 1h chart
Binance Ethereum ETHBTC 1h chart
GOLD XAUUSD 15m chart
The user who wants to use this strategy, especially via an automated bot, must always manage to set a take profit and stoploss, as well as use a proper money and risk management strategies .
This is not the "Holy Grail", so use it with caution.
This is a premium indicator , so send me a private message in order to get access to this script.